
Keyword
Regional Seas | Tasman Sea
586 record(s)
Type of resources
Topics
Keywords
Contact for the resource
Provided by
Formats
Update frequencies
Status
draft
-
The standard deviation of sea surface height (in metres) estimated on a 0.2x0.2 degree grid for the region: 90E-180E, 60S-0. Sea surface height variability was estimated from tide gauges and altimeter GDR height observations for the years 1993-2001. The gridded fields are created using optimal interpolation and the grid scale is smaller than the largest gaps between satellite tracks so fine scale 0(50km) height gradients in the ocean are often missed. For most of the time data were only available from two satellites and at times only one.
-
Monthly standard deviation of sea surface height (in metres) estimated on a 0.2 x 0.2 degree grid for the region: 90E-180E, 60S-0. Data used in making the estimates are the gridded maps of height for 1993-2001 based on tide gauge and altimeter observations. The gridded fields are created using optimal interpolation and the grid scale is smaller than the largest gaps between satellite tracks so fine scale O(50km) height gradients in the ocean are often missed. For most of the time data were only available from two satellites and at times only one.
-
This data set is the laboratory analysis of Lipids, fatty acids and sterols of numerous species of marine animals from the Tasman Sea, Pacific and Southern Ocean, collected between 1986 and 2008. Some portions of the data collection and analysis are still ongoing.
-
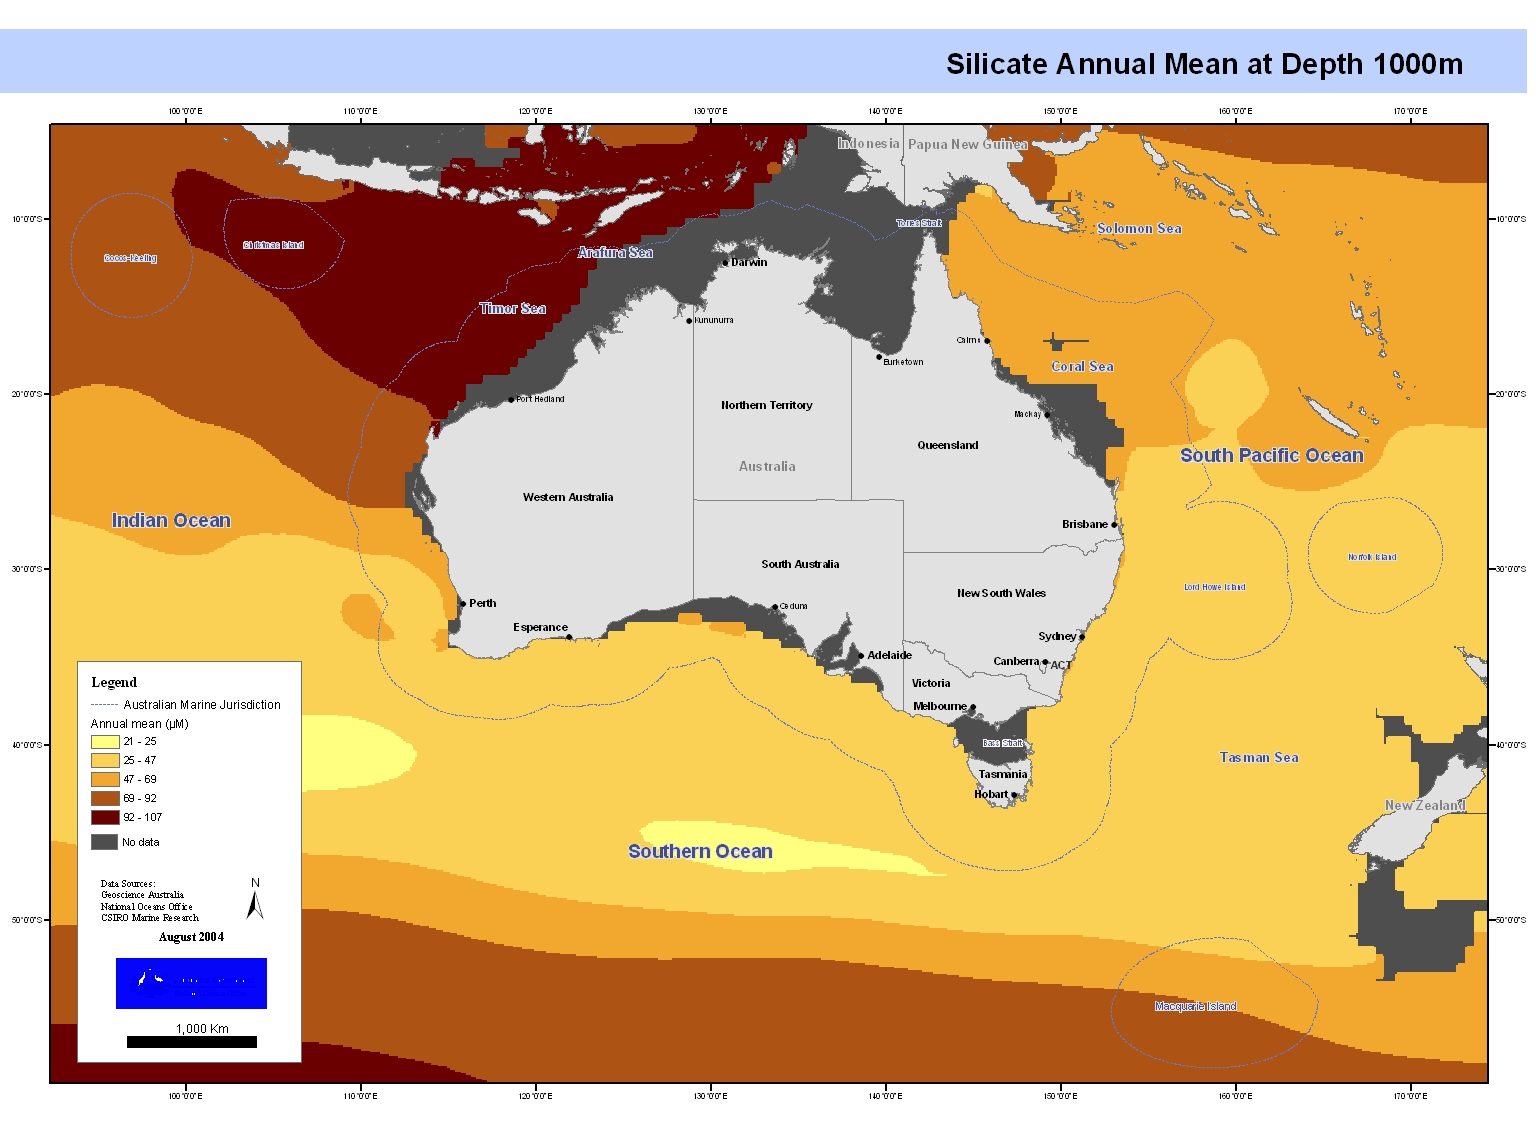
Set of maps showing sea surface silicate linearly interpolated from CARS2000 mean and seasonal fields to 0.1 degree spaced grid. These maps form part of a series of maps showing the variation of temperature, salinity, oxygen, silicate, phosphate, and nitrate in Australia's Oceans. Each feature in the series has been separately mapped at depths of 0, 150, 500, 1000 and 2000 metres. These maps have been produced by CSIRO for the National Oceans Office, as part of an ongoing commitment to natural resource planning and management through the 'National Marine Bioregionalisation' project.
-
Dynamic height of sea surface height and currents referenced to 2000m, computed from CARS2000 3-dimensional seasonal temperature and salinity fields. Monthly values derived from annual and semi-annual temperature and salinity cycles. CARS is a set of seasonal maps of temperature, salinity, dissolved oxygen, nitrate, phosphate and silicate, generated using Loess mapping from all available oceanographic data in the region. It covers the region 100-200E, 50-0S, on a 0.5 degree grid, and on 56 standard depth levels. Higher resolution versions are also available for the Australian continental shelf. The data was obtained from the World Ocean Atlas 98 and CSIRO Marine and NIWA archives. It was designed to improve on the Levitus WOA98 Atlas, in the Australian region. All known reliable published data is used, but this is still very sparse in the SW, at depth, and especially for some nutrients. In many places strong interannual signals (which in many cases we do not attempt to resolve nor compensate for) may be aliased into spatial or seasonal signals.
-
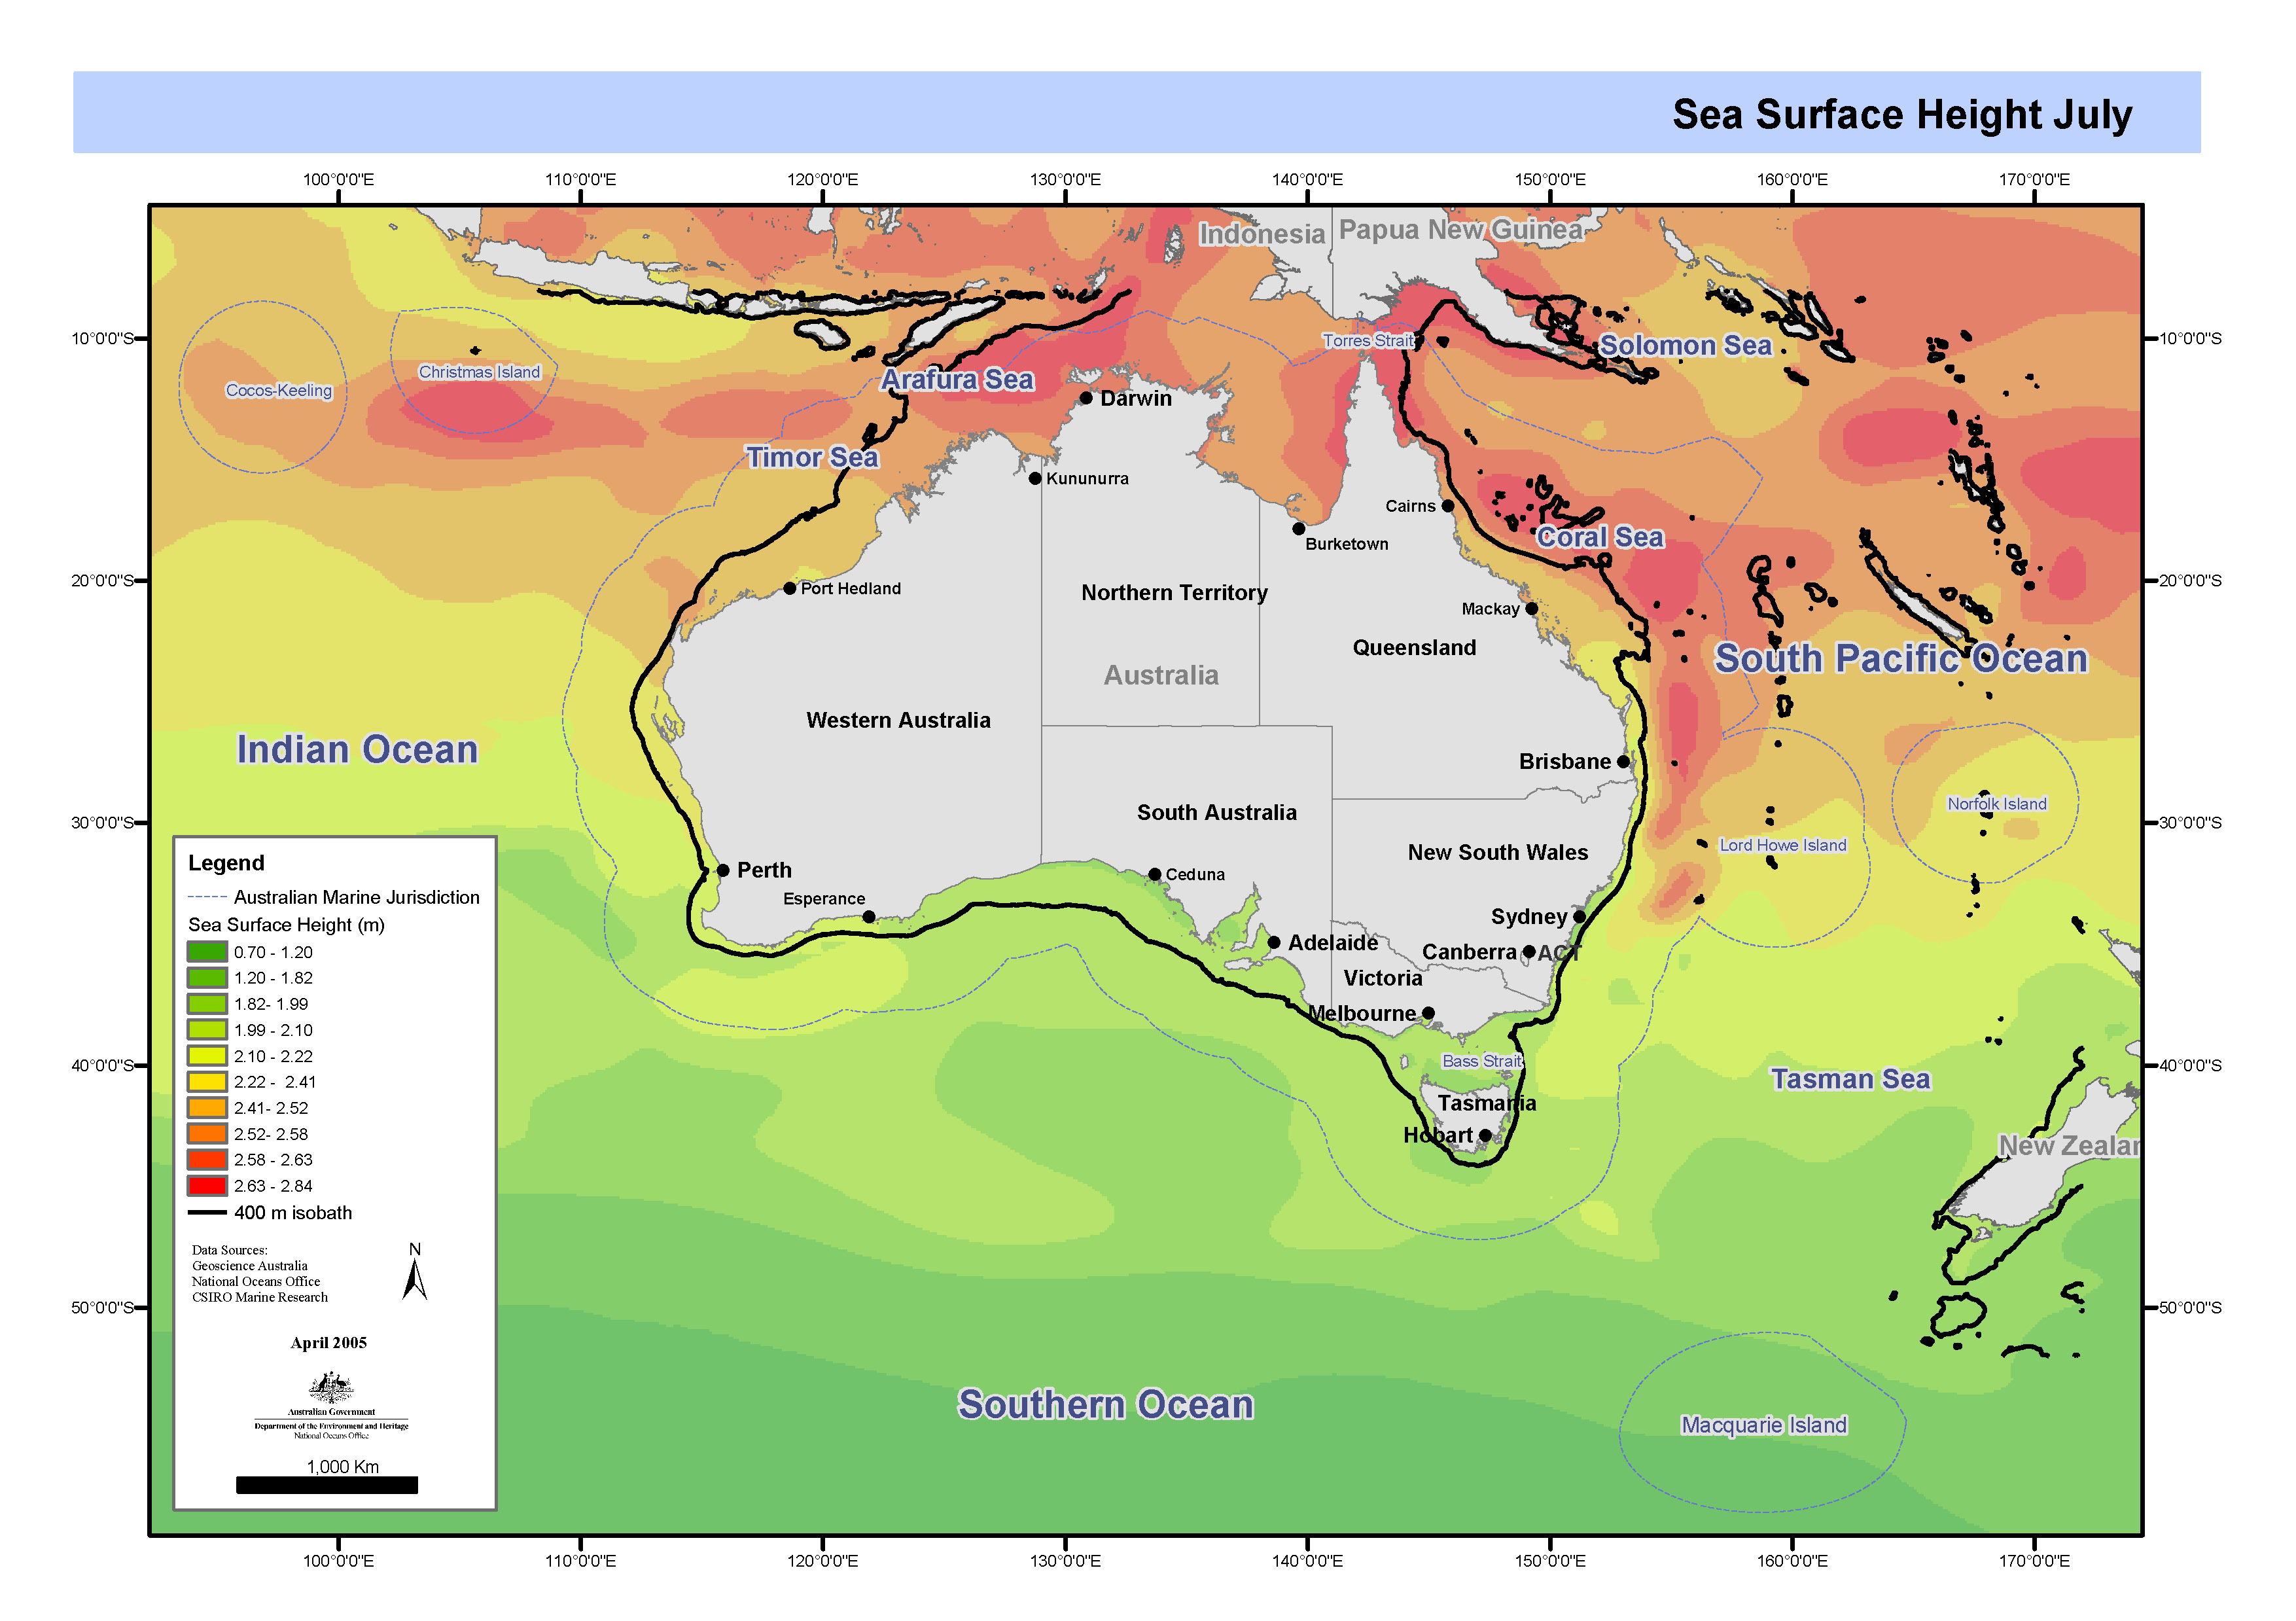
Set of four maps of mean sea surface height derived from annual and semi-annual temperature and salinity cycles stored in CARS2000. CARS is a set of seasonal maps of temperature, salinity, dissolved oxygen, nitrate, phosphate and silicate, generated using Loess mapping from all available oceanographic data. It covers the region 100-200E, 50-0S, on a 0.5 degree grid, and on 56 standard depth levels. Higher resolution versions are also available for the Australian continental shelf. The data was obtained from the World Ocean Atlas 98 and CSIRO Marine and NIWA archives. It was designed to improve on the Levitus WOA98 Atlas, in the Australian region. These maps have been produced by CSIRO for the National Oceans Office, as part of an ongoing commitment to natural resource planning and management through the 'National Marine Bioregionalisation' project. Sea surface height not defined for depths less than 400m.
-
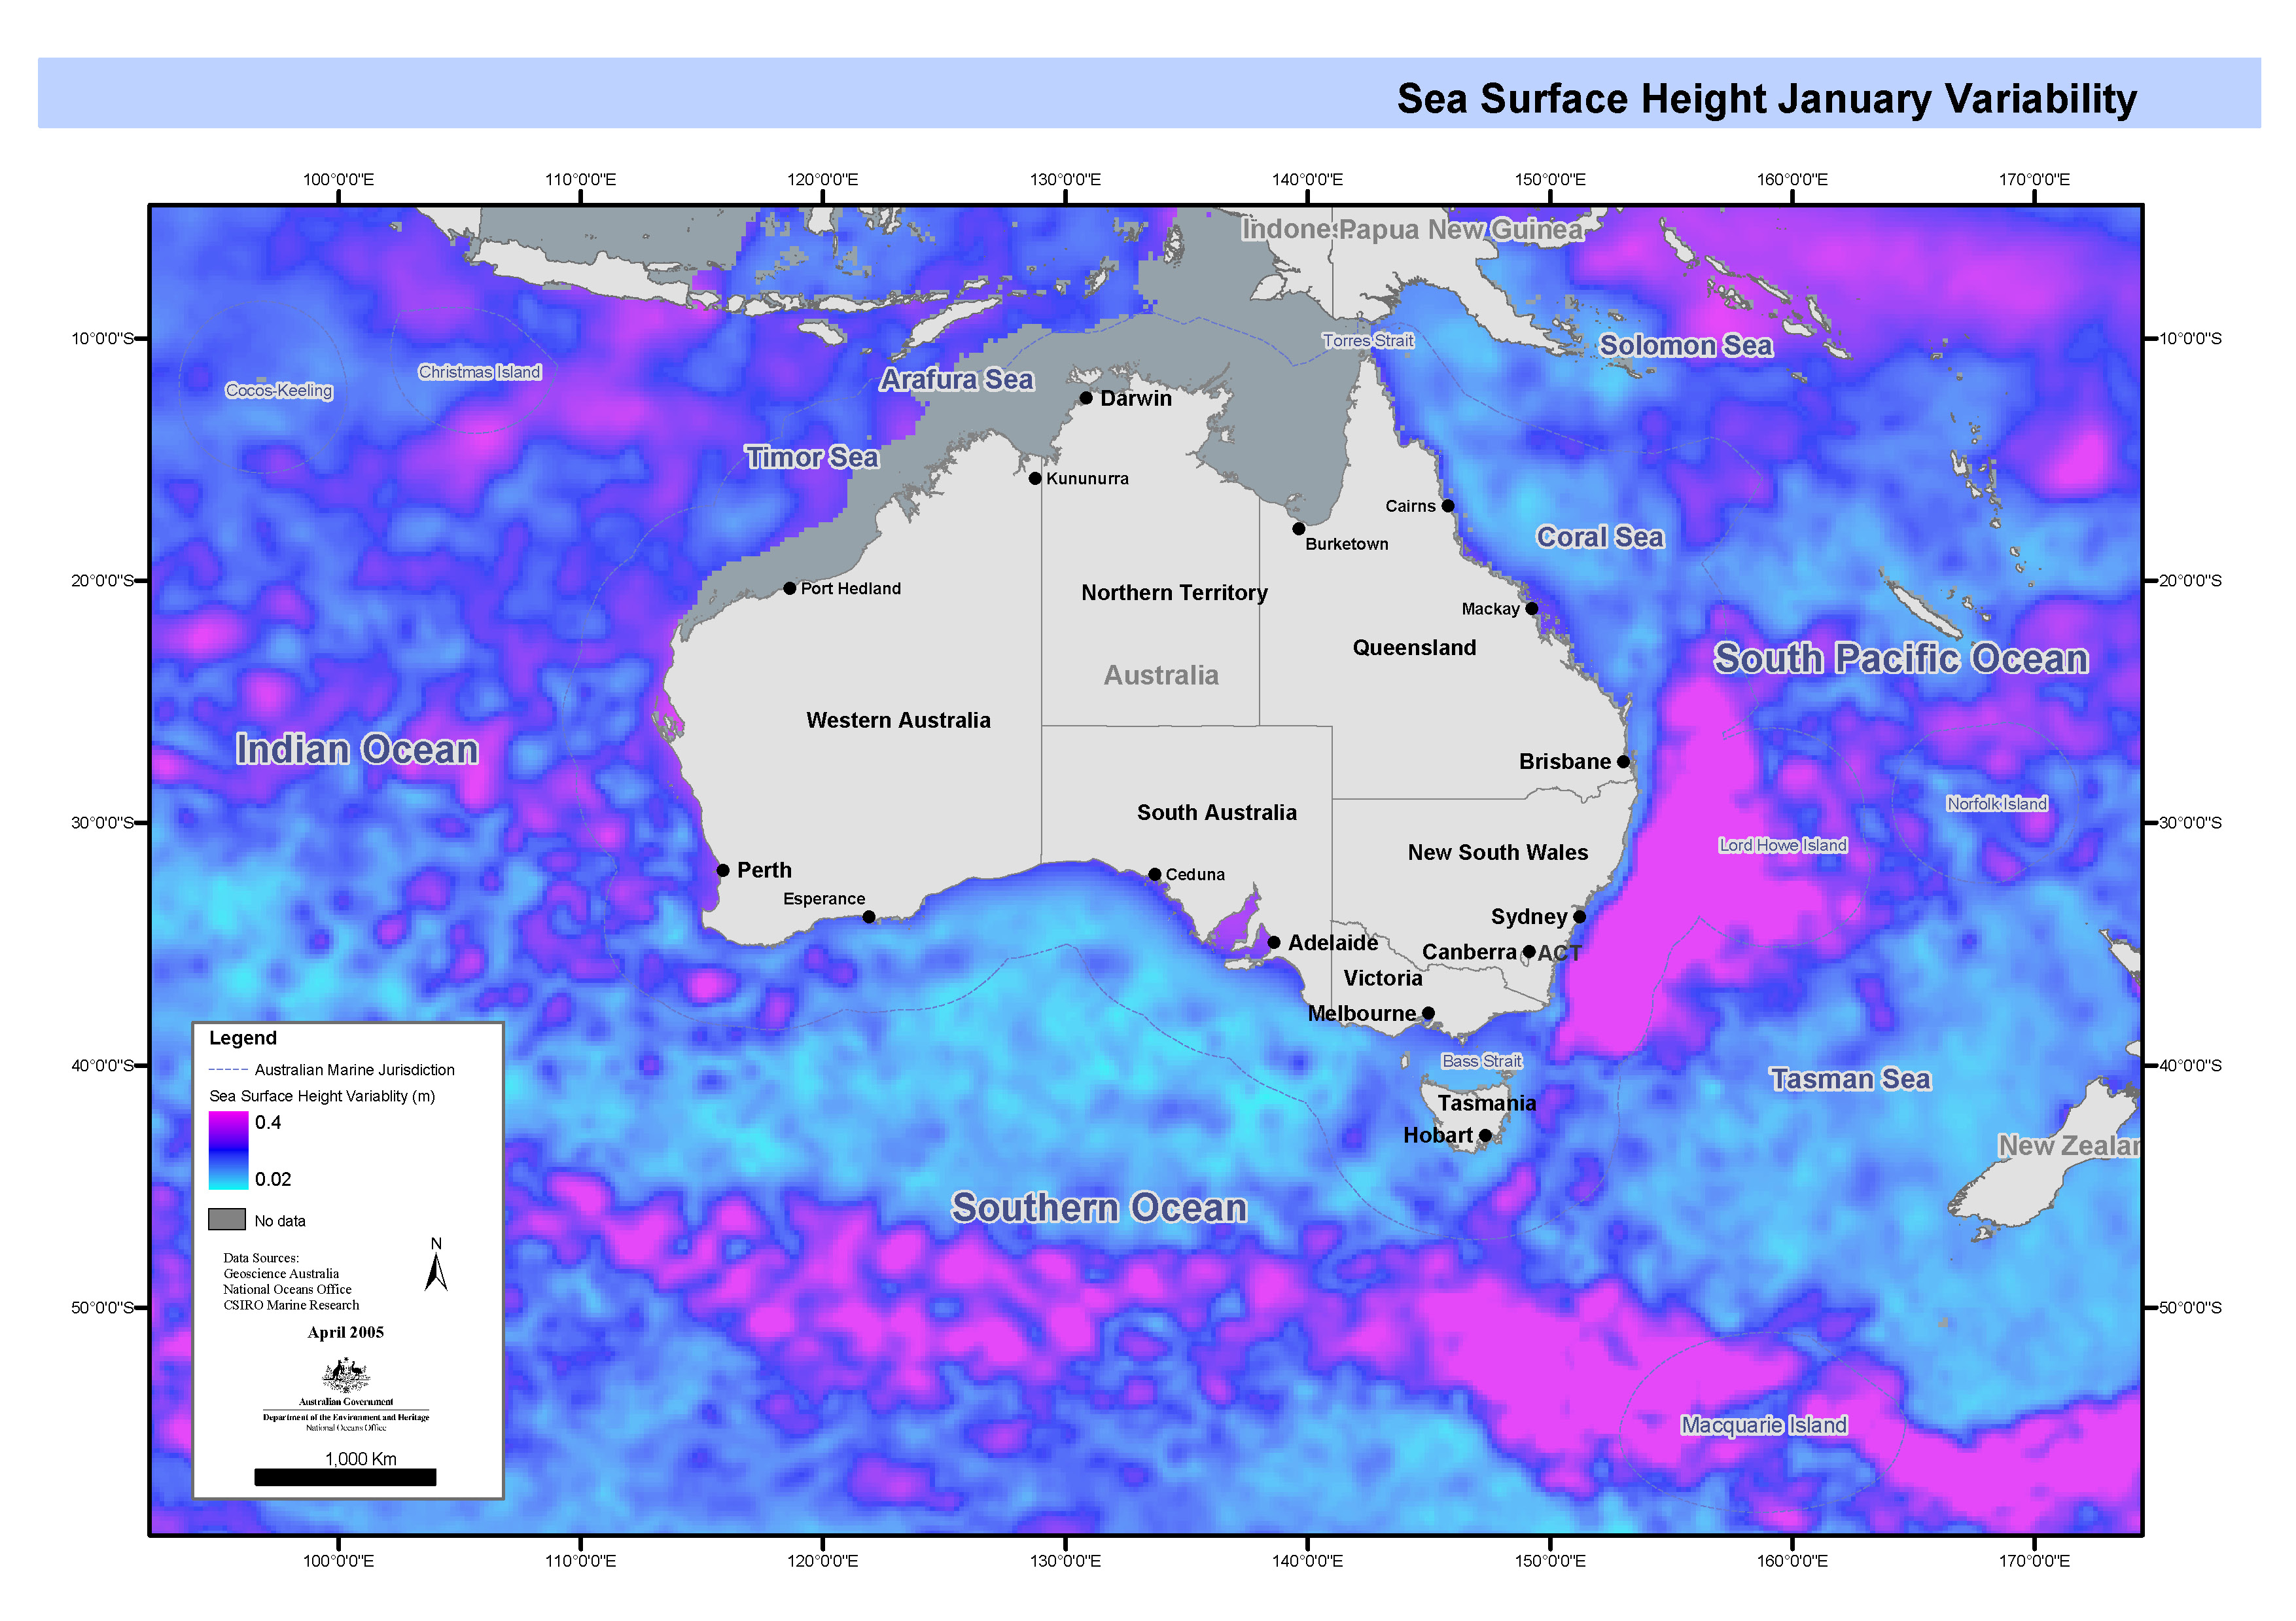
Set of maps showing monthly standard deviation of sea surface height in the Australian region for 1993-2001 based on tide gauge and altimeter observations. These maps have been produced by CSIRO for the National Oceans Office, as part of an ongoing commitment to natural resource planning and management through the 'National Marine Bioregionalisation' project.
-
Cephalopods were sampled from a cyclonic cold-core eddy in the western Tasman Sea, using midwater trawls from 10th to 12th September 2017 during a research voyage on Australia's Marine National Facility RV Investigator. Two different types of trawl equipment were used. The first trawl type sampled the upper 100 m of the eddy using a Danish pelagic trawl with 300 μm mesh, towed at approximately 1 m/s (2 knots) for 60 min per trawl (n= 9). The second trawl type was an International Young Gadoid Pelagic Trawl (IYGPT) fitted with a MIDwater Open and Closing net system with six distinct codends to enable depth stratified sampling. The IYGPT trawl has a mesh size of 200 mm reducing to 10 mm, and the codend mesh size was 500 μm. The IYGPT trawl was lowered to 500 m, with the first codend sampling obliquely from the surface to 500 m, and each subsequent codend sampled 100 m depth intervals for approximately 20 min each at 1 m/s, as the trawl returned to the surface. Data supporting this study are available from a GitHub repository archived using Zenodo https://doi.org/10.5281/zenodo.3980411 - see citation (Murphy et al., 2020). Deployment locations are from event logs stored in the ships data archive
-
Maps showing quarterly means of wind curl on Australia's oceans from interpreted basedata supplied by the National Centers for Environmental Prediction (NCEP) Re-analysis Project, 1976 to 1998 inclusive. These maps have been produced by CSIRO for the National Oceans Office, as part of an ongoing commitment to natural resource planning and management through the 'National Marine Bioregionalisation' project.
-
These data, reported in various volumes of CSIRO's "Oceanographic Station List" series between 1955 and 1962, comprise mainly measurements of surface temperature, salinity (as chlorinity), and (in later stages) phosphate from sea surface samples collected by the merchant ship TSMV "Wanganella" on regular runs between Sydney and Auckland or Wellengton, New Zealand. Sampling began in December 1952 and was still in progress December 1960, the last date for which data were published in this series. The merchant vessel sampling program was carried out at a time when the CSIRO Division of Fisheries had no dedicated ocean-going research vessel, as a means of acquiring information about offshore waters. In the volumes cited, similar data are also reported from the Coral Sea, south-eastern Australian waters and Bass Strait, and the south-east Indian Ocean.